Japanese Websites Are Faster Than American Ones: What 600,000 Sites Reveal
Reserved
·
November 9, 2026
·
6 min read
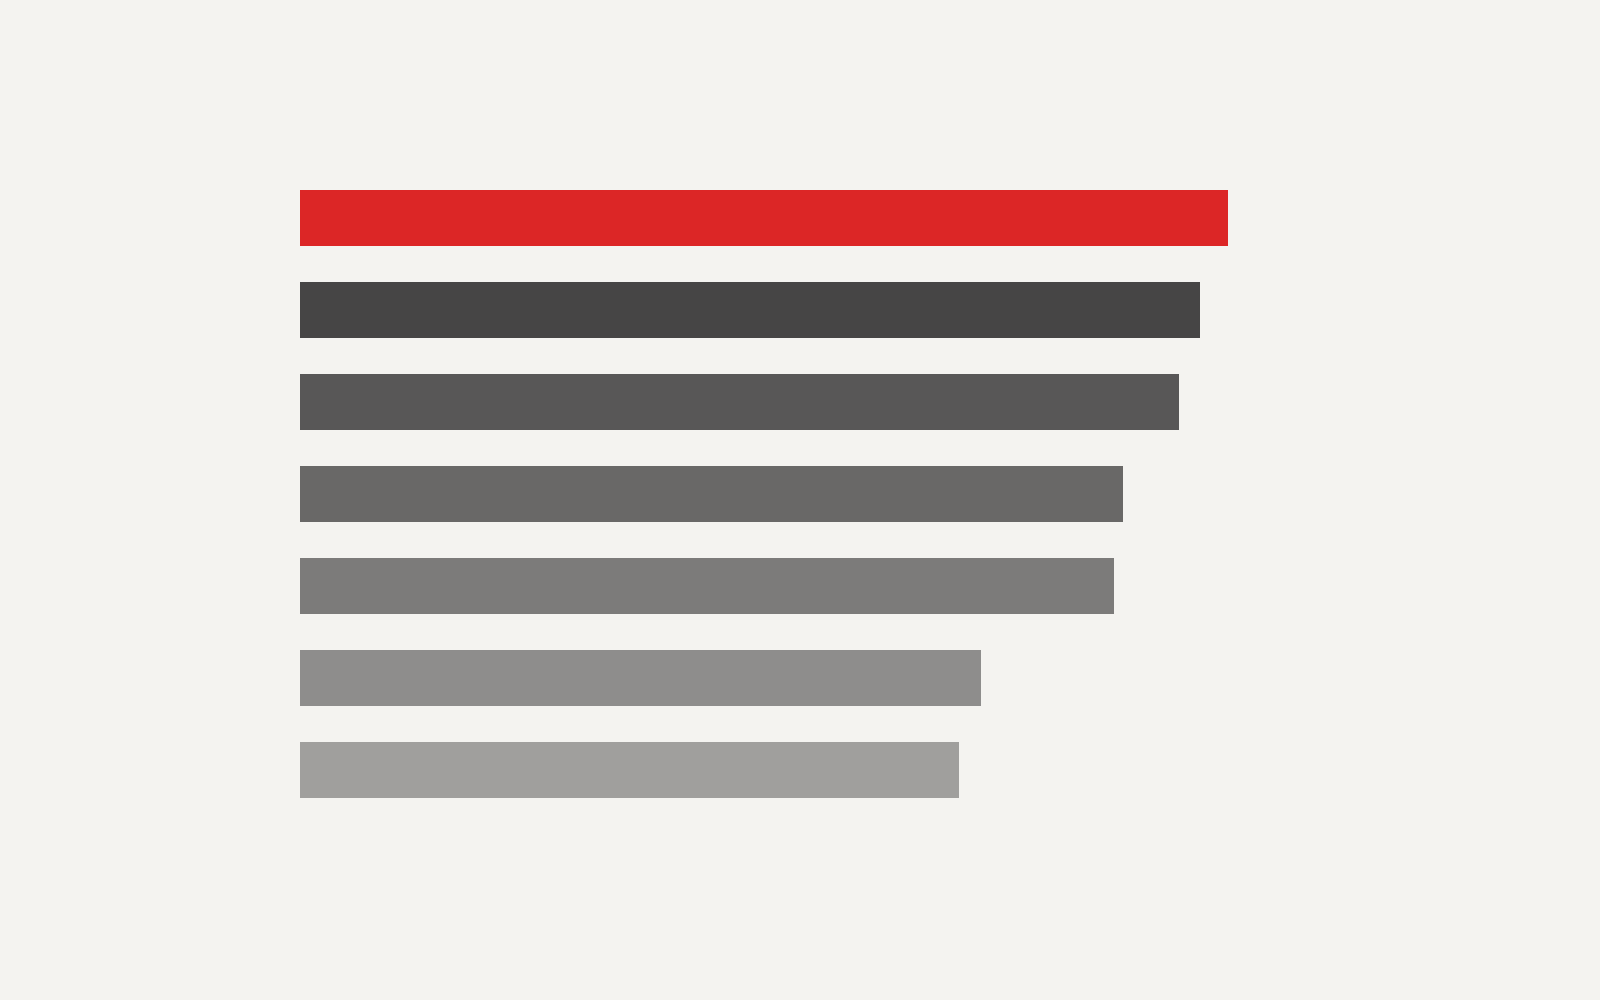
Japanese websites pass Google's Core Web Vitals more often than websites in the United States, United Kingdom, Germany and France. In HTTP Archive's September 2026 data, 71.4% of sites popular in Japan passed on mobile, compared with 63.3% in the US and 52.8% worldwide.
That runs against a familiar story. Japanese websites have a reputation for looking dated and cluttered, and we have written about why. On speed and stability, though, the data shows the opposite. Looking busy and loading slowly turn out to be separate problems.
We analysed real-user performance data for over 600,000 Japanese websites to find out why, and where Japanese sites still fall behind.
Key findings
- Japan leads the markets we compared. Its mobile pass rate of 71.4% is ahead of Germany (69.2%), the UK (67.6%), the US (63.3%) and France (62.6%).
- Japanese pages ship far less JavaScript. The median mobile page in Japan loads 663 KB of JavaScript, against 1.10 MB in the US.
- But they carry more image weight. The median Japanese mobile page loads 1.20 MB of images, about 70% more than the US median of 0.70 MB.
- Older technology performs well. Sites using jQuery pass 74.6% of the time in Japan, ahead of the national average.
- Some modern frameworks perform poorly. Only 29.1% of Japanese Nuxt.js sites pass on mobile, compared with 49.1% in the US.
- Accessibility is the weak spot. The median Lighthouse accessibility score is 83.5 in Japan and 90 in the US.
How we measured
We used the HTTP Archive Technology Report, which draws on the Chrome User Experience Report (CrUX). CrUX records how real Chrome users experience a site, rather than running a test in a lab. Sites are grouped by the country where their visitors are, so "Japan" means sites that people in Japan use.
A site passes Core Web Vitals when at least 75% of visits meet Google's thresholds for loading speed (Largest Contentful Paint), responsiveness (Interaction to Next Paint) and visual stability (Cumulative Layout Shift). All figures are from the September 2026 dataset, the latest available when we checked on 9 November 2026.
Core Web Vitals by country
| Market | Sites (mobile) | Pass rate, mobile | Pass rate, desktop | Good LCP, mobile | Good INP, mobile | Good CLS, mobile |
|---|---|---|---|---|---|---|
| Japan | 606,580 | 71.4% | 76.9% | 81.8% | 88.2% | 92.0% |
| Germany | 586,975 | 69.2% | 73.0% | 79.7% | 88.7% | 89.2% |
| United Kingdom | 412,823 | 67.6% | 69.3% | 79.1% | 86.7% | 87.6% |
| United States | 1,288,504 | 63.3% | 65.4% | 74.8% | 87.3% | 85.1% |
| France | 417,781 | 62.6% | 69.5% | 75.5% | 82.4% | 87.4% |
| Singapore | 59,225 | 52.4% | 61.0% | 64.9% | 80.3% | 82.4% |
| Australia | 166,124 | 50.7% | 56.1% | 59.1% | 84.4% | 83.3% |
| All countries | 8,569,446 | 52.8% | 60.8% | 65.6% | 79.4% | 83.4% |
Japan has the highest score of these markets on two of the three metrics: loading speed and layout stability. On responsiveness it is level with the leaders.
Why are Japanese websites fast?
The data points to several likely causes. Some are measured directly, and others are our interpretation.
1. Less JavaScript
| Median mobile page | Japan | United States |
|---|---|---|
| Total weight | 3.07 MB | 2.96 MB |
| JavaScript | 663 KB | 1.10 MB |
| Images | 1.20 MB | 0.70 MB |
Total page weight is similar, but the mix is very different. Japanese pages carry about 40% less JavaScript. That matters more than the extra images, because a browser has to download, parse and run JavaScript, which keeps the page busy, while an image only has to download and display. Heavy scripts are a common reason for slow loading and sluggish responses to taps.
2. Conservative technology choices
The habits we criticised in our earlier article, such as gradual change and long-lived systems, seem to help here. Many Japanese sites are server-rendered pages with modest scripting, and that kind of page is usually fast.
| Technology | Pass rate, Japan | Pass rate, US | Japanese sites |
|---|---|---|---|
| Wix | 91.6% | 88.7% | 10,220 |
| Shopify | 83.5% | 85.5% | 13,483 |
| jQuery | 74.6% | 64.7% | 449,053 |
| WordPress | 72.5% | 62.0% | 236,108 |
| React | 60.1% | 56.7% | 48,663 |
| Next.js | 50.8% | 51.6% | 16,507 |
| Vue.js | 47.6% | 51.6% | 27,885 |
| Nuxt.js | 29.1% | 49.1% | 9,466 |
Technologies overlap, because a site can use several at once, so this table describes groups of sites rather than isolating the effect of each tool. Even so, the pattern is clear. jQuery and WordPress sites in Japan beat the same technologies in the US by around ten points. Sites built on JavaScript frameworks do worse, both in Japan and elsewhere.
3. Fast networks and short distances
Time to first byte (TTFB) measures how quickly a server starts responding. It is good on 60.6% of Japanese sites, compared with 54.8% in the US and 36.8% in Australia. Japan is compact and densely populated, its users are close to the data centres serving them, and its mobile networks are fast. We think that explains much of the gap with Australia and Singapore, where many sites are served from far away.
4. Layouts that don't move
Japan's mobile layout stability score of 92.0% is the best in this comparison. Dense, grid-based layouts with fixed slots for images and banners give content fewer chances to jump around as it loads. That is a real strength of the information-rich style that often gets criticised.
Where Japanese websites fall behind
Accessibility
| Median Lighthouse score, mobile | Japan | United States |
|---|---|---|
| Accessibility | 83.5 | 90 |
| Performance (lab test) | 44 | 48 |
| SEO | 92 | 92 |
| Best practices | 77 | 77 |
Accessibility is the clearest gap. Common causes on Japanese sites include text inside images with no proper alternative text, low-contrast grey text and small tap targets. Japan has one of the world's oldest populations, so this affects a large share of users.
Lab scores tell a different story
Japan's median Lighthouse performance score is slightly lower than the US, even though its real-user results are better. Lighthouse simulates a mid-range phone on a slow connection, while CrUX records what actual visitors experience. Japanese users tend to have fast connections and capable phones, which can hide inefficiencies that would hurt visitors on slower networks, including tourists on roaming data.
Image weight
The extra 500 KB of images on the median page is the easiest win available. Modern formats such as WebP and AVIF, correctly sized images and live text instead of text baked into banners would cut that weight. Live text also improves accessibility, translation and search visibility.
What this means if you run a website in Japan
- Don't assume a redesign means a rebuild in a JavaScript framework. The fastest groups in this data are often the simplest technically. If you move to a framework, plan for performance from the start and measure it.
- Measure with real-user data. Use the Core Web Vitals report in Google Search Console or PageSpeed Insights, and compare your results with the Japanese average of 71.4% passing.
- Fix accessibility. It is where Japanese sites trail most, and the fixes help every user: alternative text, contrast, larger targets and real text.
- Optimise images. It is usually the cheapest improvement with the most visible effect.
- Test from abroad if you serve foreign customers. Speed that holds in Tokyo may not hold for visitors in Europe or the US.
Limitations
- CrUX only includes sites with enough Chrome traffic, so very small sites are missing.
- Sites are grouped by where their users are, not where companies are based, and global sites appear in several countries.
- Technology groups overlap, and these figures show correlations rather than causes.
- Core Web Vitals measure speed and stability. They say nothing about whether a site is easy to understand or use.
- The data covers a single month. We plan to update this analysis as new data is released.
Frequently asked questions
Are Japanese websites slow?
No. By Google's Core Web Vitals, sites popular in Japan are faster and more stable than those in the US, UK, Germany or France. They are often visually dense, but that is a design question, not a speed problem.
What percentage of websites pass Core Web Vitals?
In September 2026, 52.8% of sites worldwide passed on mobile, according to HTTP Archive. In Japan the figure was 71.4%.
Which country has the fastest websites?
Of the markets we compared, Japan had the highest mobile pass rate. We did not compare every country, so others not included here may score higher.
Is Next.js slow?
Not by itself. Next.js sites pass about half the time in both Japan and the US, below the national averages. Many are complex applications, and the framework can produce very fast sites when performance is planned for. Choosing a modern framework does not make a site fast automatically.
About this research
Reserved is a technical partner based in Tokyo. We build and improve websites and software for Japanese and international clients, including web design and performance work. If you would like to know how your site compares with these benchmarks, get in touch.
You are welcome to cite this research with a link to this page.